
October Tea Report: 2025 China Exports

Data from China Customs was recently published regarding China exports for October 2025. GATS data on US imports of tea was not available at time of publication due to reporting delays caused by the recent federal government shutdown.
China Tea Export Analysis Report
October 2025
Report Date: December 04, 2025
EXECUTIVE SUMMARY
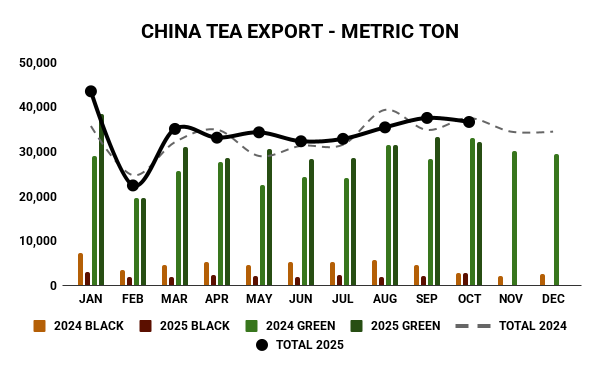
Overall Performance: China’s tea exports for the first ten months of 2025 totaled 343.61 million KG, representing a 3.8% increase compared to the same period in 2024 (330.88 million KG).
Key Highlights:
- Pure green tea (绿茶) exports grew by 13.5%, reaching 301.71 million KG
- Total unfermented teas represent 89.8% of exports, totaling 308.46 million KG
- Black tea (红茶) exports decreased 51.1%, falling to 21.72 million KG
- October 2025 showed -2.3% decline vs October 2024
- Morocco remains #1 destination with 78.71 million KG YTD (+20.4%)
- African markets dominate top 10, representing majority of exports
- Ghana continued sharp decline: -54.8% YTD
- Côte d’Ivoire explosive growth: +324.2% YTD
1. YEAR-TO-DATE PERFORMANCE (JAN-OCT 2025)
1.1 Total Export Volume
| 2025 YTD (Jan-Oct) | 2024 YTD (Jan-Oct) | Change |
| 343,605,194 KG | 330,876,413 KG | +12,728,781 KG (+3.8%) |
1.2 Green Tea (绿茶) Volume
Note: Pure green tea only, excluding jasmine tea, flower tea, and white tea (reported separately below).
| 2025 YTD | 2024 YTD | Change |
| 301,713,836 KG | 265,921,638 KG | +35,792,198 KG (+13.5%) |
1.2.1 Other Unfermented Tea Categories
In addition to pure green tea, the following unfermented tea categories contributed to total exports:
- Jasmine Tea (茉莉花茶): 5,779,859 KG (+13.4% vs 2024 YTD)
- White Tea (白茶): 357,076 KG (+0.7% vs 2024 YTD)
- Other Flower Tea (其他花茶): 607,800 KG (-42.7% vs 2024 YTD)
- Total All Unfermented Teas: 308,458,571 KG (representing 89.8% of total exports)
1.3 Black Tea (红茶) Volume Volume
| 2025 YTD | 2024 YTD | Change |
| 21,724,914 KG | 44,383,708 KG | -22,658,794 KG (-51.1%) |
2. OCTOBER 2025 PERFORMANCE
2.1 Total Export Volume
| October 2025 | October 2024 | Change |
| 36,634,122 KG | 37,505,895 KG | -871,773 KG (-2.3%) |
2.2 Green Tea (绿茶) – October
Pure green tea only (excluding jasmine, flower, and white tea)
| October 2025 | October 2024 | Change |
| 32,098,774 KG | 33,080,043 KG | -981,269 KG (-3.0%) |
2.3 Black Tea (红茶) – October
| October 2025 | October 2024 | Change |
| 2,726,864 KG | 2,641,366 KG | +85,498 KG (+3.2%) |
3. TOP 10 DESTINATIONS – YTD
| Rank | Country | 2025 KG | 2024 KG | Change % |
|---|---|---|---|---|
| 1 | 摩洛哥 (Morocco) | 78,711,450 | 65,369,431 | +20.4% |
| 2 | 乌兹别克斯坦 (Uzbekistan) | 24,655,916 | 17,166,037 | +43.6% |
| 3 | 塞内加尔 (Senegal) | 20,418,052 | 12,411,544 | +64.5% |
| 4 | 毛里塔尼亚 (Mauritania) | 15,680,864 | 13,829,838 | +13.4% |
| 5 | 加纳 (Ghana) | 15,079,246 | 33,360,202 | -54.8% |
| 6 | 俄罗斯 (Russia) | 13,258,143 | 12,253,239 | +8.2% |
| 7 | 科特迪瓦 (Côte d’Ivoire) | 13,016,779 | 3,068,280 | +324.2% |
| 8 | 阿尔及利亚 (Algeria) | 12,422,686 | 10,176,179 | +22.1% |
| 9 | 乍得 (Chad) | 9,707,354 | 4,465,793 | +117.4% |
| 10 | 日本 (Japan) | 9,382,236 | 8,601,903 | +9.1% |
Key Insights:
- 8 of top 10 destinations are African countries, dominating China’s tea export landscape
- Côte d’Ivoire shows explosive growth (+324.2%)
- Senegal demonstrates strong growth trajectory (+64.5%)
- Ghana’s dramatic reversal: from growth star (2022-2024) to sharp decline (-54.8%)
- Uzbekistan recovery momentum (+43.6% after 2022-2024 decline)
4. TOP 10 DESTINATIONS – OCTOBER 2025
| Rank | Country | 2025 KG | 2024 KG | Change % |
|---|---|---|---|---|
| 1 | 摩洛哥 (Morocco) | 10,140,583 | 9,722,794 | +4.3% |
| 2 | 乌兹别克斯坦 (Uzbekistan) | 3,237,176 | 2,353,880 | +37.5% |
| 3 | 科特迪瓦 (Côte d’Ivoire) | 2,331,064 | 917,380 | +154.1% |
| 4 | 毛里塔尼亚 (Mauritania) | 1,790,342 | 2,111,531 | -15.2% |
| 5 | 塞内加尔 (Senegal) | 1,652,076 | 1,367,471 | +20.8% |
| 6 | 阿尔及利亚 (Algeria) | 1,311,421 | 1,587,062 | -17.4% |
| 7 | 美国 (USA) | 1,282,442 | 948,162 | +35.3% |
| 8 | 德国 (Germany) | 954,559 | 1,182,462 | -19.3% |
| 9 | 日本 (Japan) | 922,415 | 758,545 | +21.6% |
| 10 | 乍得 (Chad) | 916,486 | 591,263 | +55.0% |
October Highlights:
- Côte d’Ivoire maintained explosive growth momentum (+154.1%)
- USA demonstrated strong recovery (+35.3%), re-entering top 10
- Uzbekistan consistent strong performer (+37.5%)
- Mauritania, Algeria, and Germany showed October weakness
5. TEA TYPE ANALYSIS BY DESTINATION
5.1 YTD Top 10 Countries – Tea Type Breakdown
| Country | Green Tea KG | Black Tea KG | Other Types KG |
|---|---|---|---|
| 摩洛哥 (Morocco) | 78,285,634 | 8,050 | 417,766 |
| 乌兹别克斯坦 (Uzbekistan) | 24,472,186 | 164,160 | 19,570 |
| 塞内加尔 (Senegal) | 20,161,295 | 0 | 256,757 |
| 毛里塔尼亚 (Mauritania) | 15,680,864 | 0 | 0 |
| 加纳 (Ghana) | 15,045,574 | 72 | 33,600 |
| 俄罗斯 (Russia) | 8,984,175 | 1,914,936 | 2,359,032 |
| 科特迪瓦 (Côte d’Ivoire) | 12,811,359 | 40,020 | 165,400 |
| 阿尔及利亚 (Algeria) | 12,349,620 | 73,066 | 0 |
| 乍得 (Chad) | 9,707,354 | 0 | 0 |
| 日本 (Japan) | 1,004,996 | 255,813 | 8,121,427 |
5.2 October 2025 Top 10 – Tea Type Breakdown
| Country | Green Tea KG | Black Tea KG | Other Types KG |
|---|---|---|---|
| 摩洛哥 (Morocco) | 10,074,343 | 0 | 66,240 |
| 乌兹别克斯坦 (Uzbekistan) | 3,232,877 | 2,680 | 1,619 |
| 科特迪瓦 (Côte d’Ivoire) | 2,298,664 | 0 | 32,400 |
| 毛里塔尼亚 (Mauritania) | 1,790,342 | 0 | 0 |
| 塞内加尔 (Senegal) | 1,598,996 | 0 | 53,080 |
| 阿尔及利亚 (Algeria) | 1,311,421 | 0 | 0 |
| 美国 (USA) | 587,916 | 577,965 | 116,561 |
| 德国 (Germany) | 622,682 | 238,328 | 93,549 |
| 日本 (Japan) | 239,802 | 11,449 | 671,164 |
| 乍得 (Chad) | 916,486 | 0 | 0 |
Tea Type Preferences by Market:
- African markets: Overwhelmingly prefer pure green tea (95-100%), with minimal diversification
- Morocco: 99.5% green tea – largest single market
- Russia: Diverse portfolio (68% green, 14% black, 18% specialty teas)
- Japan: Preference for specialty teas (73% oolong/dark, 27% green/black)
- USA: Balanced mix (46% green, 45% black, 9% other)
- Germany: Mixed portfolio (65% green, 25% black, 10% other)
6. THREE-YEAR TREND ANALYSIS
Total Export Volumes
- 2022: 375.19M KG (baseline)
- 2023: 367.54M KG (-2.0% vs 2022)
- 2024: 399.79M KG (+8.8% vs 2023)
- 2025 YTD: 343.61M KG (10 months)
- 2025 Annualized: 412.33M KG (+3.1% projected)
Green Tea (绿茶) Trend
Pure green tea only (excluding jasmine, flower, white)
- 2022: 313.84M KG (83.6% of total)
- 2023: 309.35M KG (-1.4%, 84.2% of total)
- 2024: 325.37M KG (+5.2%, 81.4% of total)
- 2025 YTD: 301.71M KG (87.8% of total)
Black Tea (红茶) Trend
- 2022: 33.24M KG (8.9% of total)
- 2023: 29.04M KG (-12.6%, 7.9% of total)
- 2024: 48.99M KG (+68.7%, 12.3% of total) ← Strong growth
- 2025 YTD: 21.72M KG (-55.7%, 6.3% of total) ← COLLAPSE
Key Trend Observations
- Green tea dominance intensifying: Rising from 81.4% (2024) to 87.8% (2025 YTD)
- Black tea dramatic reversal: After +68.7% growth in 2024, collapsed -55.7% in 2025
- Unfermented teas historic high: 89.8% of total (green + jasmine + flower + white)
- Specialty teas declining: Oolong (-25.7% YTD), Dark tea/Puerh also declining
7. KEY FINDINGS & INSIGHTS
7.1 DECLINES
- GHANA MARKET DECREASE
- -54.8% YTD after being fastest grower (2022-2024: +57.6%)
- Lost 18.3 million KG, dropped from #2 to #5
- OCTOBER NEGATIVE MOMENTUM
- First month with negative growth (-2.3%)
- Suggests Q4 challenges ahead, could impact full-year performance
7.2 GAINS
- WEST AFRICAN EXPANSION
- Côte d’Ivoire: +324.2% YTD (3.1M → 13.0M KG) – Exceptional growth
- Chad: +117.4% YTD (4.5M → 9.7M KG)
- Senegal: +64.5% YTD (12.4M → 20.4M KG)
- UZBEKISTAN RECOVERY
- +43.6% YTD after 2-year decline, back to #2 position
- MOROCCO STABILITY
- Consistent #1 destination with +20.4% YTD growth
- 78.7M KG (22.9% of total exports), reliable and growing
- DEVELOPED MARKETS REVIVAL
- USA: +35.3% in October, Japan: +21.6% in October
*This report was produced with the assistance of an AI agent. It was reviewed by Firsd Tea, but it is for informational purposes.